It’s rare to find an SEO specialist who doesn’t know what Google Search Console (GSC) is. As one of the considered treasures in terms of tracking SEO performance, Google Search Console is the first SEO tool any beginner (or even the most experienced digital marketers out there) will explore. At a glance, the tool can help you uncover the most important SEO data and provide you with instant analysis on what’s happening on a website.
But not all data may lead you to the right direction—Google Search Console is not an exception. There will be times when you find yourself fumbling with the data and analyzing the metrics. What does the data say about the site? How do you go from analysis to strategy? If you’re looking for answers, stick around and read the rest.
The purpose of this guide is to help digital marketing professionals better understand how Google Search Console works and determine the right metrics for a foolproof SEO strategy. Doesn’t matter whether you’re a beginner or an SEO master—this guide will provide you with all the hacks to maximize Google Search Console as an effective free SEO tool, and practice data visualization without extracting to Google Sheets or Excel.
Chapter 1: Understanding Google Search Console
In this section, we dive into how Google Search Console changed, as well as how SEO professionals are and should be using this free tool.
The Evolution of Google Search Console: So, What Changed?
During the early days of SEO, Google Search Console was commonly referred to as Google Webmaster Tools. SEO specialists use this tool along with Google Analytics to dissect how a website performs on search and optimize for better visibility.
Much like how the current Google Search Console looks, Google Webmaster Tools provides you with a dashboard that serves as an overview of your SEO data. Diving deeper into the tool, you’ll find the metrics for Search Analytics, Sitemaps, and Crawl Errors.
While the new name came with a few nifty changes, the rebranding was Google’s effort to make this tool more accessible to a wide range of users, such as small business owners, SEO hobbyists, marketers, programmers, designers, and to our belief, they even forecasted it for app developers.
Some of the most notable changes are:
- Search traffic now reflects sixteen months of data. Initially, Google Webmaster Tools can only display search traffic data with a range of three months.
- Users have more information on specific pages.
- The new tool makes it easier to monitor, fix, and request recrawls for pages with crawling issues.
- New reports are available to interpret data.
- The tool is mobile responsive, so it’s more convenient to access whenever, wherever you are.
If you’ve been using this tool during your tenure in the SEO industry, you’ll likely notice that some of the features and reports are not present.
But, don’t worry—Google has upgraded these into newer versions to make it easier for users to perform different tasks. And there will be more to come, so hang tight and try to get a feel of the new dashboard.
To give you a visual comparison, here’s the old look:

You’ve come a long way if you recognize this screenshot
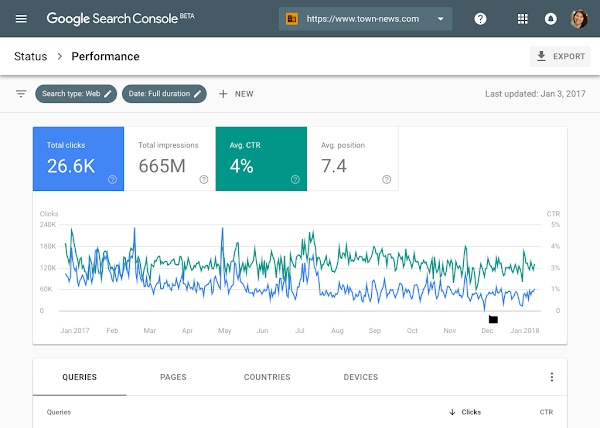
And here’s the new Google Search Console:

This is heaven-sent for modern marketers.
Pretty neat development, right?
It’s every SEO and digital marketing professional’s free tool to uncovering opportunities for ranking websites, so better start familiarizing yourself with Google Search Console.
Using Google Search Console to Maximize SEO Efforts
Here’s where it gets tricky.
While most SEO professionals stick to using Google Search Console for monitoring the health of websites they’re handling, the function of this tool goes beyond tracking rank performance. As one of the free Google SEO tools out there, Google Search Console is as handy as can be in different ways for your SEO service:
1. It Has to Do with Keywords
The beauty of this tool is it supplements keyword research without the need of being extra technical. Even those who are new will find it an exciting tool to explore.
The Performance tab of the dashboard shows the metric “queries” or the main keywords a site is ranking for. When you dive deeper, you’ll find the specific queries that specific pages are ranking for.

To maximize Google Search Console as a keyword research tool, we recommend installing Keywords Everywhere extension (Chrome or Opera browser only). By using this, you’ll find additional data not shown in the dashboard, such as search volume, cost-per-click, and competition.

The best thing about using this extension? It’s free.
2. Location Matters
Google Search Console is also a great tool for geo-location rank monitoring. Not only does it tell you where most of the site visitors are coming from, it also says a deal about whether you’re reaching the right people.
While the International Targeting tab is no longer available, Google Search Console allows you to filter your metrics based on target country. From this, you can spot opportunities to rank clients on a more global scale.
Let’s put that in an example: it’s worth looking into a website with high clicks and impressions from a specific target country so you can make the necessary adjustments to your SEO strategy.

3. Stay on Top of Your On-Page Improvements
Google Search Console can provide you with a mine of information when it comes to technical on-page fixes, such as indexing issues, crawl errors, and canonicals. A number of features support this, specifically the URL Inspection tool, Coverage, and Enhancements of your dashboard.
The URL Inspection tool is an improved Fetch as Google tool on your GSC dashboard, and this can help you uncover a variety of things for specific pages. It takes just a couple of seconds for the dashboard to retrieve data from Google Index and display the results. You can use this tool if you’re planning to implement on-page changes or publish a new page.

You can also do a live URL test to confirm if Googlebots can access and index a specific page on the site. Results will show how the tested page will appear to both search crawlers and humans, while also indicating elements that prevent Googlebots from fully indexing the site.
But if you want to find where a website is bleeding and what causes the bleed, the Coverage report is a good place to start digging.
Under the Coverage report, you can determine if the pages were indexed or not, as well as pages excluded from being indexed and possible issues that you need to know about.

This makes it easier for you to discern if the site was compromised. For instance, if you find URLs that are not related to the content of the website, this may indicate malicious attacks on the website.
4. Find Out Who Links to You the Most
Whoever said link building is dead probably has never experienced how powerful a strategy this can be. Links are still one of the biggest ranking factors in SEO—the more authoritative links a website has, the higher it can rank.
But, how do you know who’s linking to you and what makes them link back to you? The Links report can answer this.
This report shows the domains with the most links to the website, as well as the top linked pages by other websites and from external links. If you want to dive deeper into your data, you’ll also find the top anchor texts used for linking back to the site and the specific pages with the most links coming from a given website.
This report is highly useful in different scenarios:
- Identifying trustworthy websites from the spammy ones linking back to the website
- Determining whether the links are relevant to the industry of the website
- Knowing how users navigate from a specific site to a specific page
- Developing your next topics based on the pages getting the most external links (it means, the content is interesting enough to be linked to by other websites)’
- Making sure there are no discrepancies in linking core pages of the site
Key Takeaways
- Look at Keyword Difficulty – How competitive the keyword is can be an indicator if it’s worth the effort to rank for. Use Keywords Everywhere extension to see the competition levels of keywords on Google Search Console.
- Be Mindful of Migrations – HTTP and HTTPS protocols may provide different data because Google Search Console treats both versions separately. This means if you have pages that share both protocols, you need to have separate Google Search Console properties to make sure you’re getting the right data.
Chapter 2: Knowing Your Metrics
Knowing how to navigate Google Search Console is one thing; knowing how all the data work together is another story.
This is a story every SEO and digital marketing professional wants to hear.
In your Google Search Console dashboard, you can filter your data based on specific metrics so you can interpret them better (more on this later in our Data Studio Chapter!).
This section will help you get a firm grasp on how these metrics play a role in developing your SEO strategy.
Let’s Start with the Essentials
Before attempting to analyze, it’s important to familiarize yourself with the key metrics you’ll find in the Google Search Console dashboard.
For this Chapter, we’ll focus on the metrics in the Performance tab.
If you’re already familiar with these metrics, it’s okay—treat this as a refresher to help you navigate the new dashboard better before moving onto Chapter 3.
Clicks
Clicks serve as your main indicators of traffic going to the website from search result pages.
If a user clicks a link from the search results, that will be considered as one click.
However, if you go back to the search results and click on the same link again, Google won’t count this towards your data.
Impressions
Impressions refer to the number of times a website appears in a search result. Users don’t need to scroll all the way down the page – or even go to the succeeding pages of search results – to see the link for Google to count it as an impression. Keeping track of the number of impressions for a website allows you to measure its visibility for specific terms.
Click-through rate (CTR)
Click-through rate serves as the main metric for determining the percentage of users that click on a website each time it appears on search results. You can calculate the CTR of a site simply by the formula:
Number of Clicks / Number of Impressions x 100
We’ll later tell you why monitoring this metric is just as important as the others.
Position
This is the average ranking of a website in search results pages for queries. A URL can rank for different positions based on the query—by determining the average position, you can gauge the performance of the site. For instance, the URL is ranking on the fourth position for one query and fifth for another. Its average position will be 4.5.
What Does the Data Say?
Metrics will mean nothing if you don’t interpret them. It’s common for some SEO specialists (especially those new in the field) to have a fear of making recommendations because of wrong analysis from their Google Search Console data.
We’re here to put a lid on such fears and make it easier for you to look at your important metrics.
1. Web, Image, Video Search: Is There a Difference?
Google Search Console can allow you to filter queries based search types: Web, Image, and Video. While SEO professionals go over their data via the Web search type, it’s also worth looking at other search types to uncover opportunities.
Image search, for instance, can be another measure for visibility.
When you go to the Performance report and choose Image Search Type, you’ll find the top pages that appear when users do an image search based on specific queries.
This offers another avenue for optimizing image alt-tags with queries appearing on your Search Console dashboard to make the website more visible.
The same goes for Video Search Type, in which you can optimize videos with captions that target the top queries or keywords from your audience.
2. Understanding the Dips and Lifts
Paying close attention to your metrics can steer your SEO in the right direction. But, it goes beyond looking at one set of data that makes an SEO strategy successful. It’s about knowing how all the information pans out.
Your next task then is to understand how every drop and spike in your metrics.
Clicks vs Impressions
Analyzing the clicks and impressions of a website can help you discern if there’s a discrepancy in performance. You can start by looking at the queries. You can easily identify which queries are getting the most impressions but low amount of clicks, and which ones are sending you traffic.
If the number of clicks for a query is low but the impression is high, it might be because the page is not ranking high. This presents an opportunity to optimize that page, starting with the page title, description, and content.
Clicks vs CTR
These two metrics influence one another. Naturally, the higher the clicks, the higher the CTR. But, if thousands of people see the website (impressions) on search results and no one clicks on it, the CTR will suffer. And this puts all your efforts to waste.
Impressions vs Average Position
Interpreting the position value on its own can lead to misleading assumptions.
You need to contextualize this metric if you want to come up with a more accurate assumption and a clearer direction for your SEO strategy.
One way to do this is by looking at the impression count.
When it comes to movement, the number of impressions a site is getting can affect its average position.
A page can have a low average position when it receives additional impressions for new keywords that are not ranking.
Key Takeaways
So, here’s the big question – how do you influence these metrics to boost the website’s performance. Our experts provide a few key takeaways as you optimize websites:
- Review and optimize the Meta titles and descriptions of the website – Make them compelling and clear. Look at the queries on Google Search Console and find a way to insert these keywords into the title and descriptions of the site.
- Optimize the site’s URLs – Page URLs should be descriptive, meaning visitors can understand at a glance what the page is about. Use keywords in the URL, for example: https://www.examplewebsite.com/seo-business-strategy.
- Use Yoast – If the site is on WordPress, Yoast provides you with a snippet preview of how the page will appear on Google search results. This makes it easier to optimize Meta titles and descriptions.
- Don’t forget about speed – A site that takes too long to load can turn visitors away. Website speed is important for maintaining a smooth user experience, which, in turn, helps in improving click throughs.
Chapter 3: Integrating and Analyzing Google Search Console Data into Google Data Studio
Analytics is an important step in developing SEO strategies, but it’s also the most challenging for digital marketing and SEO professionals, especially when you have the K-factor of multiple analytics systems coming together, each with their multiple factors of difficulty.
In Chapter 1: Understanding Google Search Console, we highlighted the ability to work in retrospect of up to 16 months of data against demographic filters. In our last Chapter: Understanding Key Metrics of Google Search Console, we defined the relationship between clicks, impressions, clickthrough rates, and average position meant.
This chapter is about bridging the data and seeing more than just clicks.
What bridges Google Analytics, Google Search Console, and Google Ads together is Google Data Studio.
It’s far more powerful for deciphering and consolidating multiple queries into one table. Learn how to integrate your data and use this tool to compare and analyze your most important metrics.
This guide will help you interpret data better, and forecast your next tactical approach to your marketing. Consolidate, interpret, and report information from Google Search Console using Google Data Studio.
From Google Search Console to Google Data Studio
With Google Data Studio, you can easily visualize how each of the SEO metrics correlates with one another. While it does take time initially to get started, the time-saving cost is worth it in the long run, and we promise you – this is better than downloading it into Excel or Google Sheets.
What makes Google Data Studio a worthy addition to your SEO tools is the flexibility that it offers with third-party data (plus, what marketer doesn’t love the words – “it’s free”).
You can integrate data from other sources, such as Google Analytics, and third-party applications such as SEMRush to create highly detailed charts and see how different the metrics play out against your forecasting.
Organizing Your Reports
Now comes the fun part of using Google Data Studio – resource management.
There are hundreds of data points to connect in Data Studio, but we’re going to focus on Google Search Console. You can follow the steps outlined by Google on how to connect your Search Console data.

The trick is to choose your metrics wisely. It’s better to migrate all your information into data studio first, then create the information that matters —otherwise, this completely defeats the purpose of using Data Studio to organize data from Google Search Console.
You’ll find the information you need as Site Impressions or URL Impressions.
Site Impressions:

URL Impressions:
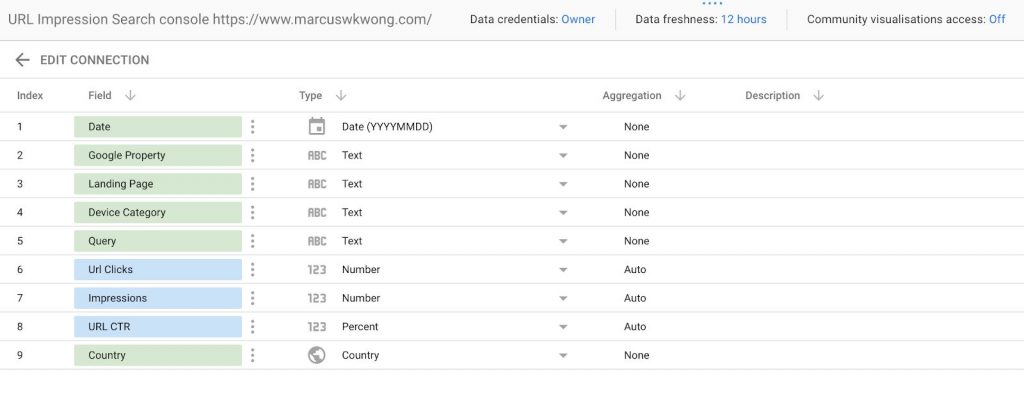
Notice the difference?
Site impression provides you with an accurate query, while URL impressions will provide you with the Landing Page.
You’ll have access to both these data aggregation methods. However, a single data source can only use one of these. As Google’s help doc stated, “To see your site impressions and URL impressions side by side, create two data sources and add both to a single report.”
You can go about this in two ways: full customized or based on Google’s template.
If you’re new to Data Studio, don’t worry.
You’ll find tons of templates in the Template Gallery on the central interface to make your life easier when organizing your reports and get familiar with how it all works together.
But if you want to go the extra mile and be more granular with your data, you can customize your reports, add your metrics, and choose your dimensions.
A couple of pointers before you get started on organizing reports:
- Only Share What is Necessary – Starting from a blank canvas lets you highlight the most important data from Google Search Console. This also makes it easier to contextualize your reports and explain to clients the progress of their SEO campaigns.
- Start With Google’s Template – What’s great about Data Studio is you can customize reports with a theme so your charts reflect your brand colors. Whether you’re presenting these reports to internal stakeholders or clients, a marketing channel specific theme will definitely provide you with plus points.
- Make Use of the Date Range and Filters – Filtering your information is extremely powerful in Data Studio. You can dynamically adjust dates as you need in just a few simple clicks, and highlight your filters to isolate Country and Device category in the Google Search Console Data Studio template. More than that, you can build custom filters to segment your data to key pages.

We’ve always found it easier to measure 100 times, report once (per month). Starting with a theme will familiarize yourself to seeing the data being represented, and help you create your own template with the insights you need.
Diving into Your Google Search Console Data
Starting off, let’s compare what you see in Data Studio vs what you see in Google Search Console. You can easily pull the impressions, clicks, average positions, and click-through rates.
Monthly Impressions Comparison

This shows a month-on-month comparison of impressions for the website. This is highly useful if you want to look at visibility trends.
Click Tracking

Use this chart to visualize traffic movement. By adding clicks as your metrics and using date as the dimension, you’ll have a time range to display the performance of the website you’re tracking on Google Search Console. Keep in mind, though, users that pogo-stick won’t attribute here.
Top Performing Pages and Queries

The neat thing about using Data Studio is you can have information on top performing pages and queries without having to configure filters. This makes it easier to compare data (impressions, clicks, average position, or CTR—depending on what metrics you want to track) on the fly and get back to your clients who are asking for updates.
While Google Search Console provides a reliable platform to get organic search visibility data, it comes with a few limitations that make data a bit clunky. By configuring your impressions, clicks, CTR and average position in Google Data Studio, you can add another level of precision through filters.

For example, you want to extract information about the United States and Australia. Where Search Console limits you to one, in Data Studio, you can connect the two in a filter and add it to any table, chart or scoreboard.
That way, a table like this:

Breaks down into this:

By utilizing filters, you can accumulate SERP information into one, and solve the unnecessary habits of calculating key page performance through Search Console one at a time. The only limitation in this instance is that the filter via “Create Filter” limits you to a maximum of 10 conditions.
Key Takeaways
- Google Data Studio makes it easy to report manipulated Google Search Console Data Without Breaking into Google Analytics
- Use Google Data Studio Filters to isolate demographics
- Identify Key Pages with the “OR” Condition in Filters
- Identify Weak CTR based on content
- Automate Reporting by setting a daily report to your email
Chapter 4: Planning Your Next Move
You know your metrics and you have the data. So, what’s next?
In this section, we’ll give you a rundown of how you can strategize your next SEO efforts with the data you got from Google Search Console.
Using Data to Develop Your Next SEO Strategy
Tracking metrics is not only about providing transparency that your current SEO strategy works. It’s also about learning what you can do to go from good to great.
1. Find Your Low Hanging Fruit
Most SEO professionals and digital marketers tend to aim for the moon. Who can blame them, though? Going beyond the expectations of your clients can be extremely satisfying.
But, what’s more satisfying is being able to hit small wins that eventually bring in big impact to the business.
In Google Search Console, you’ll find these small wins in the form of queries. With data on impressions and clicks of queries that show up in search results, you can determine which terms are your low hanging fruit. These are keywords with a relatively high impression count but with a low number of clicks and a low click-through.
Like these ones:

Use these queries as your jump off point to write content and build new topics that you can link back to the site, which brings us to the next point.
2. Identify Your Unicorn Content
What do we mean by “unicorn content”?
This refers to content that has metrics off the charts. The content is so good that it drives six times the CTR than a regular blog post.
Naturally, when you find the unicorn content, you will do everything in your power to maximize its performance and bring in more good results for the website.
- Repurpose the content – Don’t stop at blogs. Repurpose the content for short informational videos or infographics.
- Focus on interaction – The more creative and engaging the content is, the better.
- Give it a new spin – This is not the same as rehashing content. What you do is rewriting the topic in a new perspective to provide value-adding information to a specific target audience.
- Don’t forget about distribution – As our marketing team always say, “Never. Stop. Promoting.” The moment you stop distributing content is the moment you’re taking away the shine of your unicorn content.
Once you get the hang of this, you can soon turn those donkey content into unicorns and see a boost on the website’s performance.
3. Infuse Your SEO Audits with the Right Data
Here’s a fact – you don’t recommend a strategy if you don’t have the numbers to prove it.
This is where SEO audits become handy.
Think of this as your blueprint when building the SEO strategy. This document shows the overall health of the website, as well as the opportunities that can help it rank better.
If you’ve set up Google Search Console properly, it will be easy for you to pull data to include in your SEO audits:
- Identifying monthly ranking movements
- Finding optimization opportunities for target queries
- Providing technical recommendations to boost website performance
- Recommending content optimization
Key Takeaways
A solid strategy starts with having the right information. As you move forward in your SEO planning, always remember these key takeaways:
- Aim for the small, quick wins first – Your low hanging fruits are there for the taking. Don’t let these opportunities pass.
- Why look for a donkey when you can have a unicorn – It’s not a game of who has the most content; it’s about who has the BEST content out there. Always aim for quality.
- Don’t forget your SEO checkup – Also known as your SEO audit. Clients will trust you if you have facts to back up your recommendations.
Chapter 5: Rank Tracking
SEO and digital marketing professionals – and even businesses – consider ranking as the ultimate precursor of success. After all, how well they’re ranking on the search results serve as an indication that their SEO strategies are working.
There’s more to SEO success than ranking, though.
Staying on the top positions on search results will amount to nothing if the traffic coming in isn’t what the website needs. This means SEO professionals should be extra meticulous with how they use rank tracker tools, and that’s what we’ll be covering in this section.
How SEO Tools Track Rankings vs How Google Search Console Does It
Most SEO tools run desktop applications or web-based SaaS that provides more coverage for metrics and includes multipurpose features (search volume, estimated traffic, keyword difficulty to rank, average cost per click etc).
Most of these tools use their own algorithms and web crawlers to track rankings of websites based on the conditions of:
- Domain: Some tools allow you to explore and get information across the entire site or specific URLs, with side-by-side comparisons of your website and the competitor’s website.
- Location/Country: Visualize localized ranking updates and metrics with location-based data.
- SERP Features: This can be the featured image, the answer box, “people also ask” section, knowledge graph, and Google Snack Pack.
- Query: This provides tracked keywords for a specific website, allowing you to spot new queries and supplement your keyword research efforts.
Tools such as Ahrefs, Moz and SEMRush are by far the most popular web applications on the market to deliver rank tracking. But what they don’t provide you with is a precise level of data to the degree of Google Search Console. That’s not to say that they’re not useful in your arsenal of SEO software platforms and tools, but they display the right metrics for you to consider for keyword research.

What these SEO tools provide is a deeper understanding of your website’s Search Engine Optimization performance, opportunities and challenges. More importantly, you can identify how your competitor’s websites are faring against yours across as many of the 200 rank factors as possible.
Competitor site analysis is a feature in most online SEO tools that aggregate backlink data, keywords, and Google Ads information. But as we mentioned earlier, SEO tools provide you with only an estimation (though highly educated).
Web-based tools often use APIs to tap into rank tracking data from Google. What this does is it allows rank tracking tools to send automated queries without using multiple IP addresses. Tools running as a desktop application often use a rotating list of IP addresses. This makes automated queries appear like they’re coming from different locations.
Now, getting information about all the keywords in the world is impossible for any scraper. That doesn’t mean they haven’t tried. Ahrefs, for example, has produced Petabytes of information with their scraper and it’s still crawling SERP results at faster rates each year.
This is really the differentiating factor: a scraper is designed to review existing rank data, not aggregate.
This is why some personalities such as John Mueller, Senior Webmaster Trends Analyst of Google called SEO tools like SEMRush a “black hat scraper”. They’re not entirely ethical because the use case is still a grey area. Because of these SEO tools, Google has forced the evolution of Search Algorithms to combat specialists who game the system.
Google Search Console relies on direct queries that come from Google search traffic. This means the data you’re getting comes from the search engine itself. Any impressions are true to their value, and it provides you with precise data on the metrics that matter: Impressions, Clicks, Avg. Position, CTR (Click-through Rate).
This is where it’s complimentary to be skilled in both Google Search Console and third party SEO tools. Google Search Console provides the most accurate information, while third party SEO tools are great for content ideation.
In our previous chapter, you’ll find how we extract data from Google Search Console beyond the capabilities of using just Google Search Console’s User Interface.
Interpreting Google Search Console Ranking Data
When it comes to rank tracking, the metric you need to pay attention to is the position data on Google Search Console. We’ve mentioned this metric briefly in Chapter 2, but we’re going to dig deeper into how you can analyze this metric and incorporate this in your SEO strategy.
Traffic loss is often attributed to changes in rankings. So when there’s a sharp drop on the position data, those who are not savvy with Google Search Console go into a frenzy and make immediate, thoughtless changes to their strategies.
Using Google Search Console entails a thorough understanding of the position data. Otherwise, this may bring about misleading assumptions. The position data is a precarious metric because its value can vary in different situations – location, date, and even device used in search queries.
So, how do you make sure you’re rank tracking is spot on with Google Search Console?
Query Level Data
Do you look at position data from a page level?
When there are new queries popping up for a page, it’s likely the page will not rank high for those queries. This makes the average position go down and, in turn, result in assumptions of the page not doing really well in terms of rankings.
But, that’s only because your analysis comes from a page-level point of view. You need to go into query level to get a more accurate reading on position data. This allows you to drill down into irrelevant queries and focus on the ones ranking in higher positions (ideally, position 3 to 7) for better optimization.
Dates and Seasonality as a Factor
Here’s what you need to understand when looking at position data—you can’t compare the data you had yesterday with the one you have today. This is because search demands change day-to-day.
Instead of comparing the position data of this week’s Monday and Tuesday, it’s better to compare data from the Monday of the current week with the same day of the previous week.
Seasonality is also an important factor when looking at position data. Notice how there’s often a spike in queries around holidays. This is why comparing positions year-over-year makes it easier to analyze ranking movements.
Making the Most of the Position Data on Google Search Console
If you treat the position data as simply a metric for success, this won’t provide you with any use for your SEO strategy. So, how do you leverage this?
Looking for Internal Linking Opportunities
The position data can help you identify underperforming pages or those that need a little push to get to the first page. These are often pages on positions #5 to #10 – others consider optimizing a page on position #11 to get it on the first page of search results.
Once you’ve identified these pages, you need to look for your authority or well-performing pages. These are the ones with high impression and click count. Link these authority pages to the underperforming ones to pass on some of the link juice and boost the latter’s rankings.
Optimizing Relevant Queries
When optimizing pages, look at the queries they’re ranking for. Look for queries that are below positions #3 and focus on these. These queries are already ranking and have the potential to drive traffic but may require a bit of optimization to get on higher positions.
If these queries are relevant to the page, find a way to integrate them into the content. This makes it easier to skyscrape content and rank the page for additional queries.
Key Takeaways
The position data provides you with more information than just ranking drops and spikes; it’s a matter of knowing how metrics work together.
- Don’t treat the position data solely as a precursor to success – Use the position data to make adjustments and additional optimizations for the website.
- Consider factors that influence ranking movements – Examples of these are dates and seasonality as we explained previously.
Conclusion
Google Search Console is a powerful tool for everyone – whether you’re a neophyte or someone people consider as an SEO master.
But like any other SEO tools out there, it all boils down to how you use it. If you know how to filter, compare, and analyze your data, you’ll become better at forecasting and steering your SEO strategies toward the right direction.
So, here’s what we have to say: don’t be afraid to investigate.


