Google isn’t the only company that understands the importance of data. The rise of information dashboards in 2013 shows that many business owners see how understanding and analyzing data can help them improve their products and services, and allow them to make better business decisions. In December 2013, the International Institute for Analytics (IIA) predicted that data visualization will increase for high and low complexity analytics in 2014.
Throughout 2013, we’ve seen an increase in the number of software vendors offering information dashboards as a key part of their services.

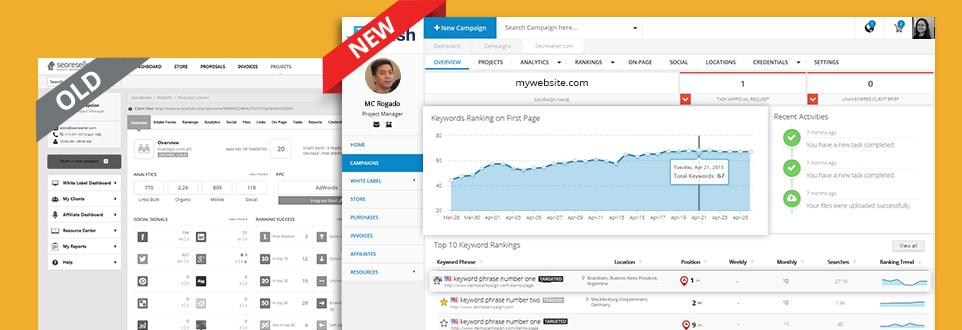
In the digital marketing industry, it’s important for service providers like us to keep up with their clients’ increasing demands for better data visualization. That’s exactly why we built our dashboard in the first place, and why we redesigned it and added awesome new features to it in 2014. We want to allow both the reseller and their end clients to access their data, and our dashboard presents it to them in an organized and digestible way.
To stay on top our partners’ needs and the industry’s evolution, we make it a point to analyze emerging trends and the latest best practices when it comes to data visualization. Here are a few things that I’m expecting to see in 2014.
An Increased Focus on Real-Time Data
Real-time data was all the rage in 2013, and it will just keep gaining popularity in 2014. Knowing where your rankings stand and how well your digital marketing campaign is doing in real-time will help you spot its strengths and weaknesses, formulate a better plan of action, and find better opportunities.

Data on the Go with Mobile Dashboards
Users rely on their mobile devices for almost everything, and data analysis is no exception. Software providers need to make sure their clients can access their data while on the go. Well-executed responsive design is an excellent way to optimize visual data for viewing on different devices, and many software providers are already using it to cater to their mobile users.

The Rise of Predictive Analytics
Marketers and business owners rely on data for more than just getting an overview of past and present results. By analyzing past and present data, it’s possible to create forecasts and predictions of future results, and adapt their digital campaigns accordingly. Predictive analytics can be tricky for SEO, since you also have to think about how Google’s algorithms could change in the future and how they can affect your rankings and SERP visibility.
We have always evolved with our partners’ and their clients’ changing needs, and they can expect to see many more improvements in the future. Sign-up as our partner today to and start using the industry’s most powerful dashboard.
Remember – we also have an on-going promo for new customers throughout the month of March. Don’t hesitate to sign-up!